Mike's Tom DeMark Lines: Boundaries of Momentum
Mike's Tom DeMark Lines: Boundaries of Momentum
Having explored Mike Bollinger Bands for volatility and Mike Ichimoku for structure, we now turn to Mike's Tom DeMark Lines. These powerful tools, derived from the renowned technical analyst Tom DeMark, provide critical boundaries for understanding the potential limits of Mike's (Volatility Mike) movement.
Mike TD Sequential & TDST Lines: Defining Potential Reversal Zones
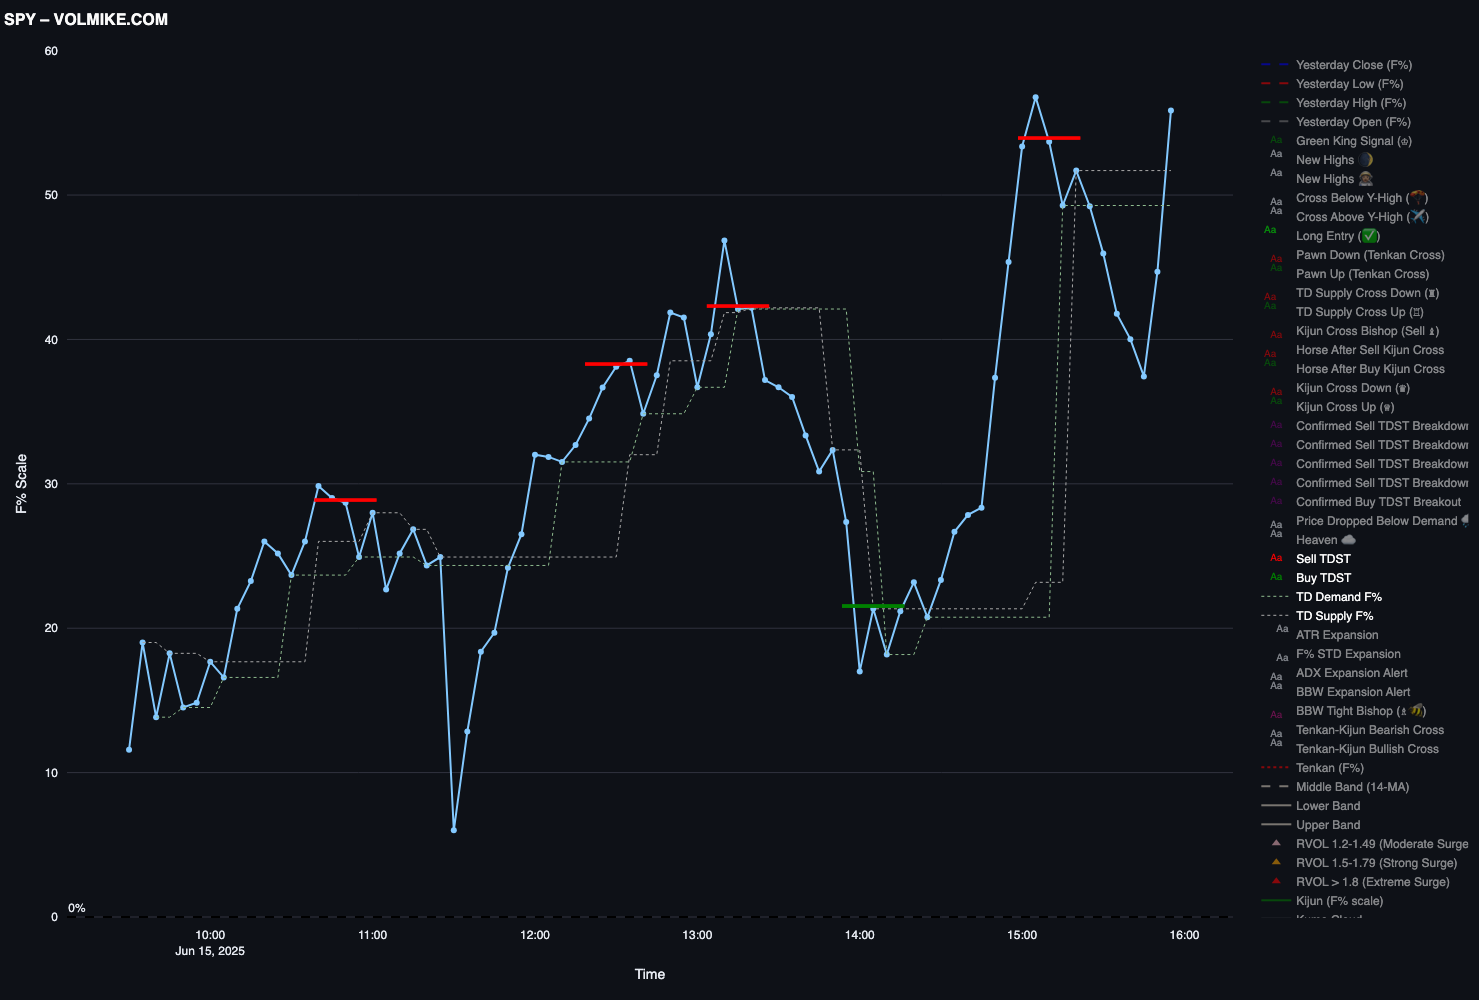
We apply TD Sequential directly to the Mike indicator to generate Buy and Sell TDST (TD Sequential Trend) lines. These lines act as potential areas of support and resistance for Mike's momentum.
- Buy TDST Lines: Indicate potential areas where downward momentum might find support and a reversal to the upside could occur.
- Sell TDST Lines: Indicate potential areas where upward momentum might encounter resistance and a reversal to the downside could occur.
These TDST lines help us identify potential turning points in the daily percentage change, giving us crucial context for anticipating the end of a momentum thrust or the beginning of a new one. They act as key boundaries within Mike's daily range.
Mike TD Supply and Demand Lines: Dynamic Levels of Engagement
In addition to the TDST lines, we also utilize Mike TD Supply and Demand lines. These are dynamic levels, calculated based on Mike's price action, that move continually throughout the trading day. They represent areas where buying or selling pressure is likely to be concentrated.
Unlike fixed support and resistance levels, these Supply and Demand lines adapt to the ongoing flow of market activity, providing a more real-time perspective on potential areas of conflict or agreement between buyers and sellers of momentum.
The Rook Connection: Crossing Supply/Demand
The crossing of these Mike TD Supply and Demand lines holds particular significance within our "chess metaphor" system. A decisive cross above a Mike TD Supply line represents the emergence of a Green Rook (🟢), while a decisive cross below a Mike TD Demand line represents the emergence of a Red Rook (🔴).
(Note: The full implications and strategic use of the "Rook" within our chess metaphor will be discussed in its own dedicated chapter.)
These "Rook" signals, triggered by Mike crossing these dynamic Supply and Demand levels, often indicate a significant shift in the immediate momentum and potential for a sustained move in that direction.
Importance for Marengo Setups
Mike's Tom DeMark Lines provide essential context for our "Marengo" setups. The TDST lines help us anticipate potential reversals from extreme momentum levels (as indicated by Mike touching its Bollinger Bands), while the dynamic Supply and Demand lines offer real-time triggers for potential continuations or shifts in the prevailing momentum. The appearance of a "Rook" signal, based on these lines, can be a powerful confirmation for entering a high-conviction trade.
By understanding and utilizing Mike's Tom DeMark Lines, we gain valuable insights into the potential boundaries and dynamic engagement levels of market momentum, further refining our ability to identify and capitalize on high-probability trading opportunities.